Calendar
Navigating days and seeing the month at a glance.
The calendar
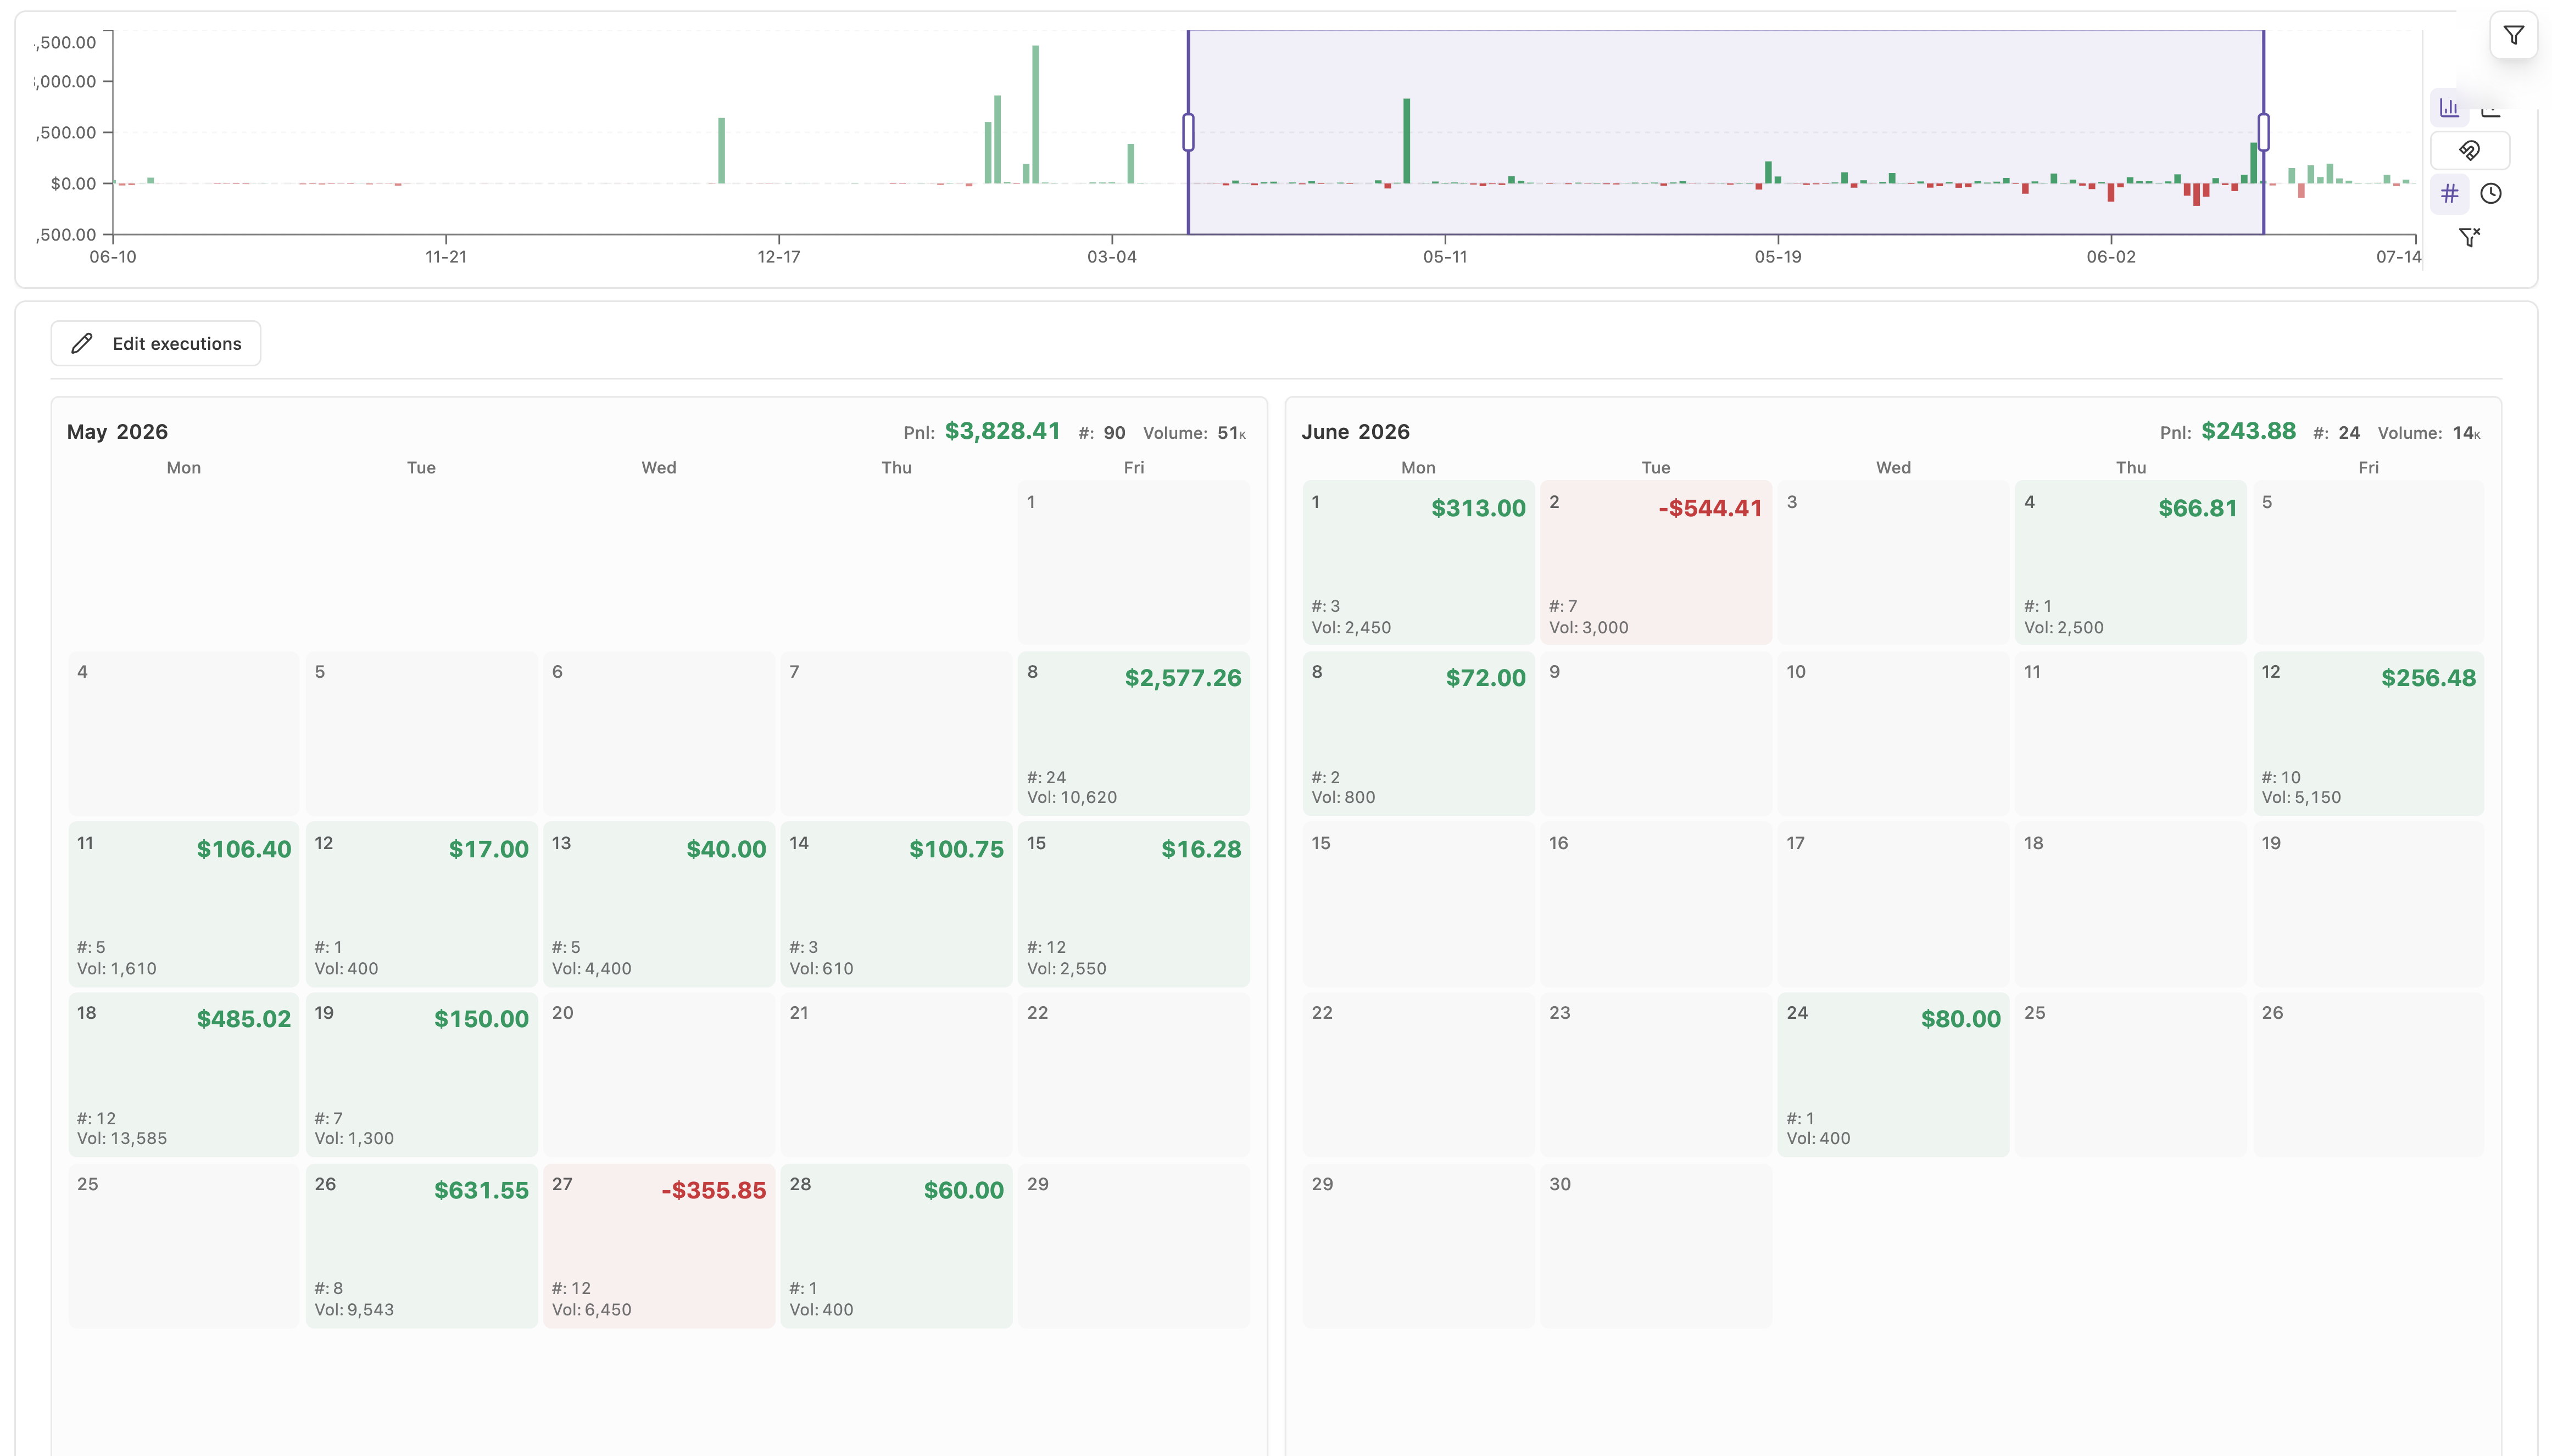
The Calendar shows a month of trading days. Each day cell carries the metrics you have bound to it, coloured by result, with today ringed and the selected day highlighted.
Controls:
- Previous month and Next month.
- The month and year labels are clickable to jump directly (Click to select month, Click to select year).
- Weekend columns appear only when there is weekend data.
- Days with no trades say so on hover.
- Days from your most recent import are marked, which is useful for confirming that an import landed where you expected.
Clicking a day selects it, and any screen using the Selected (ET) time preset follows.
A range variant shows two months side by side for picking a span: click a start date, then an end date, and the selected span is outlined.
The calendar is the best place to spot a rhythm problem. Clusters of red on the same weekday, or red immediately after a large green day, are patterns that no summary statistic will show you.
The calendar deliberately does not let you delete executions. If you try, it says so: trades stay in your trail, and to give yourself a scoring break you exclude trades from scoring in the evaluator instead of deleting them.